Emissions are no longer following the worst case scenario
If you step back in time to 2014, global CO2 emission told a pretty frightening story. Emissions had rapidly increased at a rate of 3% per year in the 2000s, and there was not much sign yet of a slowdown in the early 2010s. Global emissions appeared to be following the worst case (RCP8.5) scenario.
But over the last decade things have started to change.
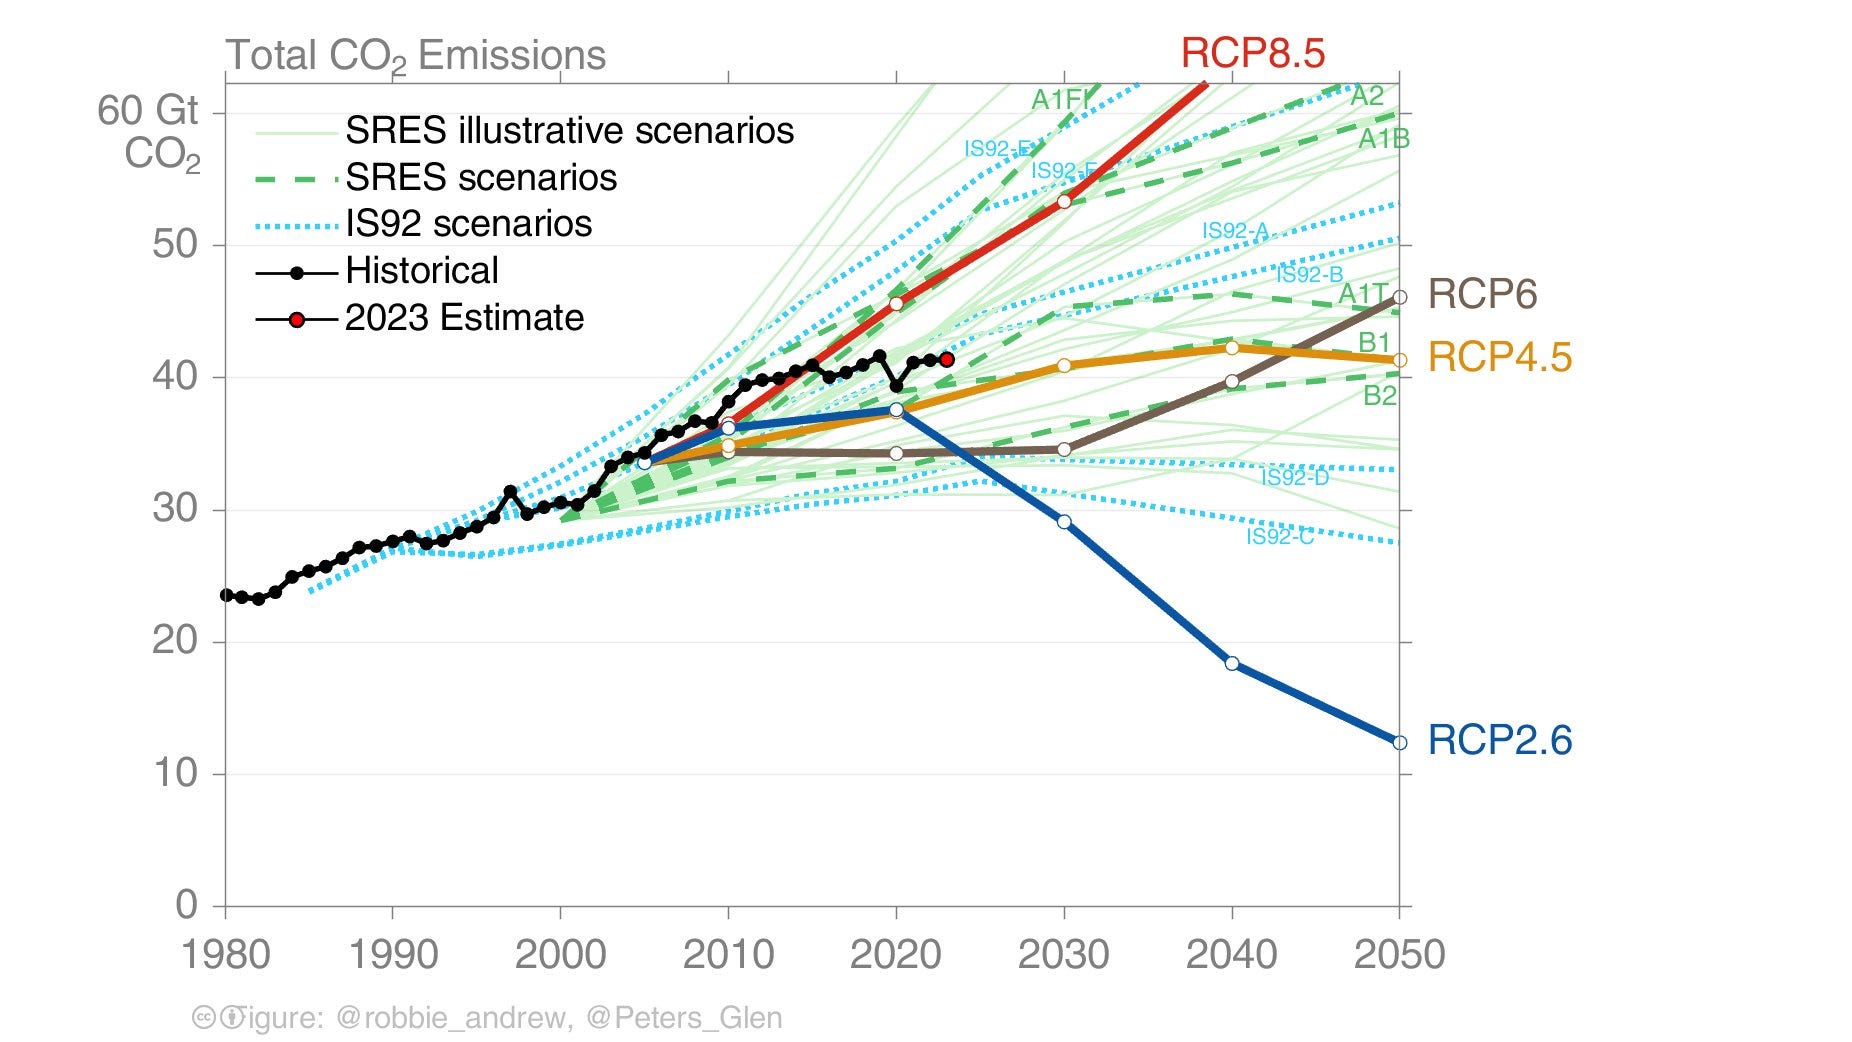 Comparison of global CO2 emissions (black line, both fossil and land use) to the RCP scenarios (thick colored lines) and older IPCC scenarios (thin lines). Figure courtesy of Glen Peters.
Global CO2 emissions (both fossil and land use) have been relatively flat during the 13 years after 2010, and are now closer to the middle-of-the-road RCP4.5 scenario than the high-end RCP8.5 one1. This is even more clear if we look at fossil CO2, which is the most important factor in long-term growth (as its responsible for 90%+ of future emissions in high-end scenarios).
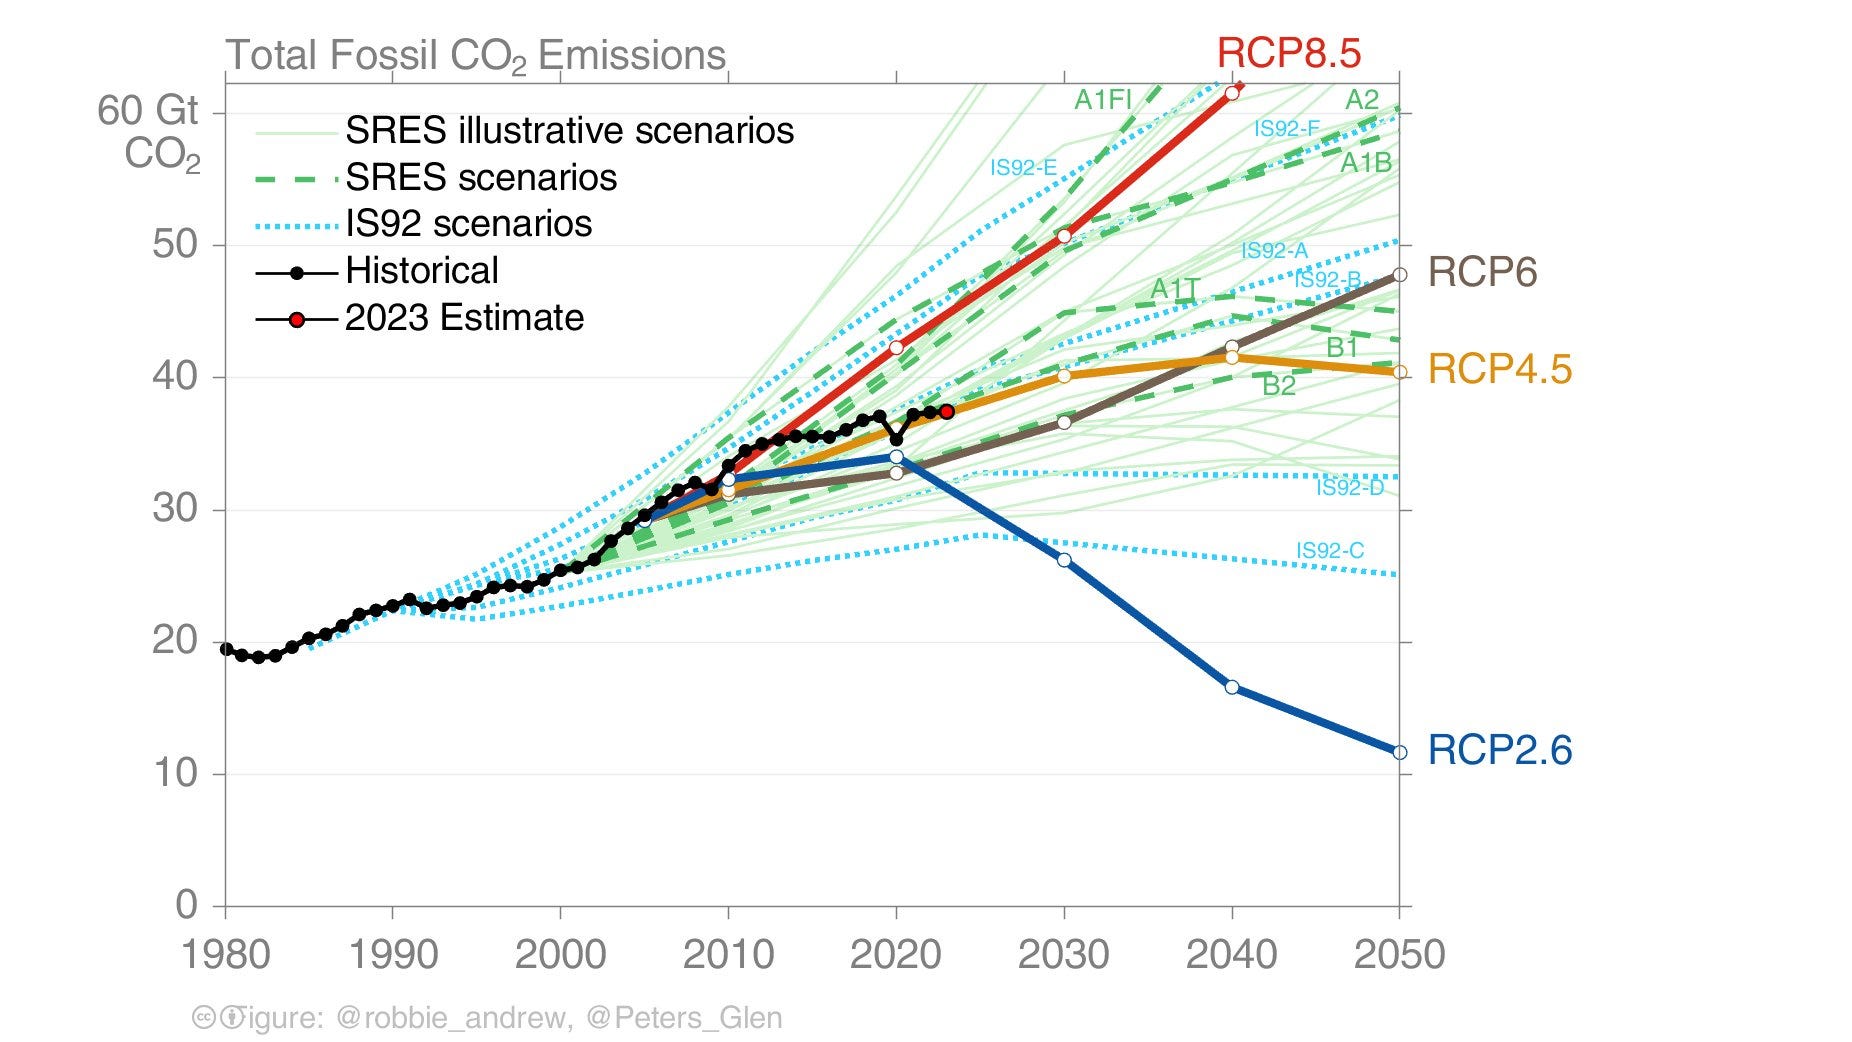 Comparison of global fossil CO2 emissions to the RCP scenarios and older IPCC scenarios. Figure courtesy of Glen Peters.
This is due to the rapidly accelerating energy transition driven by falling costs of clean energy technologies, that has led to a stagnation of global coal use. The world spent $1.1 trillion dollars on clean energy technologies in 2022, up from around $780 billion in 2021 and $600 billion in 2020, a trend that shows no sign of slowing down.
Even more importantly, there is a growing consensus in the literature that global emissions are likely to remain flat even in the absence of strong climate policies enacted by countries. The figure below is from the IPCC 6th Assessment Report Synthesis, and shows the range of assessed current policy projections for global CO2 emissions in red (along with a somewhat arbitrary selected marker scenario in with a solid red line).
 Figure Figure SPM.5 from the AR6 Synthesis Report (2023). The red area shows the range of current policy scenarios in the literature, with the darker part showing the more likely scenarios. Green and blue areas show below-2C and 1.5C emissions scenarios, respectively.
What does this flattening of emissions and divergence from the high-end scenario mean for the climate going forward? First, its important to emphasize that a flatting of emissions does not mean that global warming will stop or the problem will be solved. The amount of warming the world experiences is a function of our cumulative emissions, and the world will not stop warming until we get emissions all the way to net-zero. Even after we reach net-zero emissions, the world will not cool back down for many millennia to come in the absence of removing more CO2 from the atmosphere than we emit.
This is the brutal math of climate change, and the reason why its so important to start reducing our emissions quickly. We are already well off track for what would be needed to limit warming to 1.5C without large overshoot (and the need for lots of negative emissions to bring temperatures back down). If we do not start reducing global emissions over the coming decade, plausible scenarios to limit warming to below 2C will move out of reach as well.
Second, its important to note that emissions are only one of three sources of uncertainty when we try to assess out how much the climate will warming this century. The other major factors are how sensitive the climate is to our emissions – the combination of various physical processes that amplify warming from greenhouse gases, such as increased evaporation, changes in cloud formation, or melting snow and ice – as well as how the carbon cycle responds to our emissions and how that affects the ability of the Earth to take up a portion of what we emit.
The figure below provides a visual summary of these different uncertainties based on estimates in the literature.
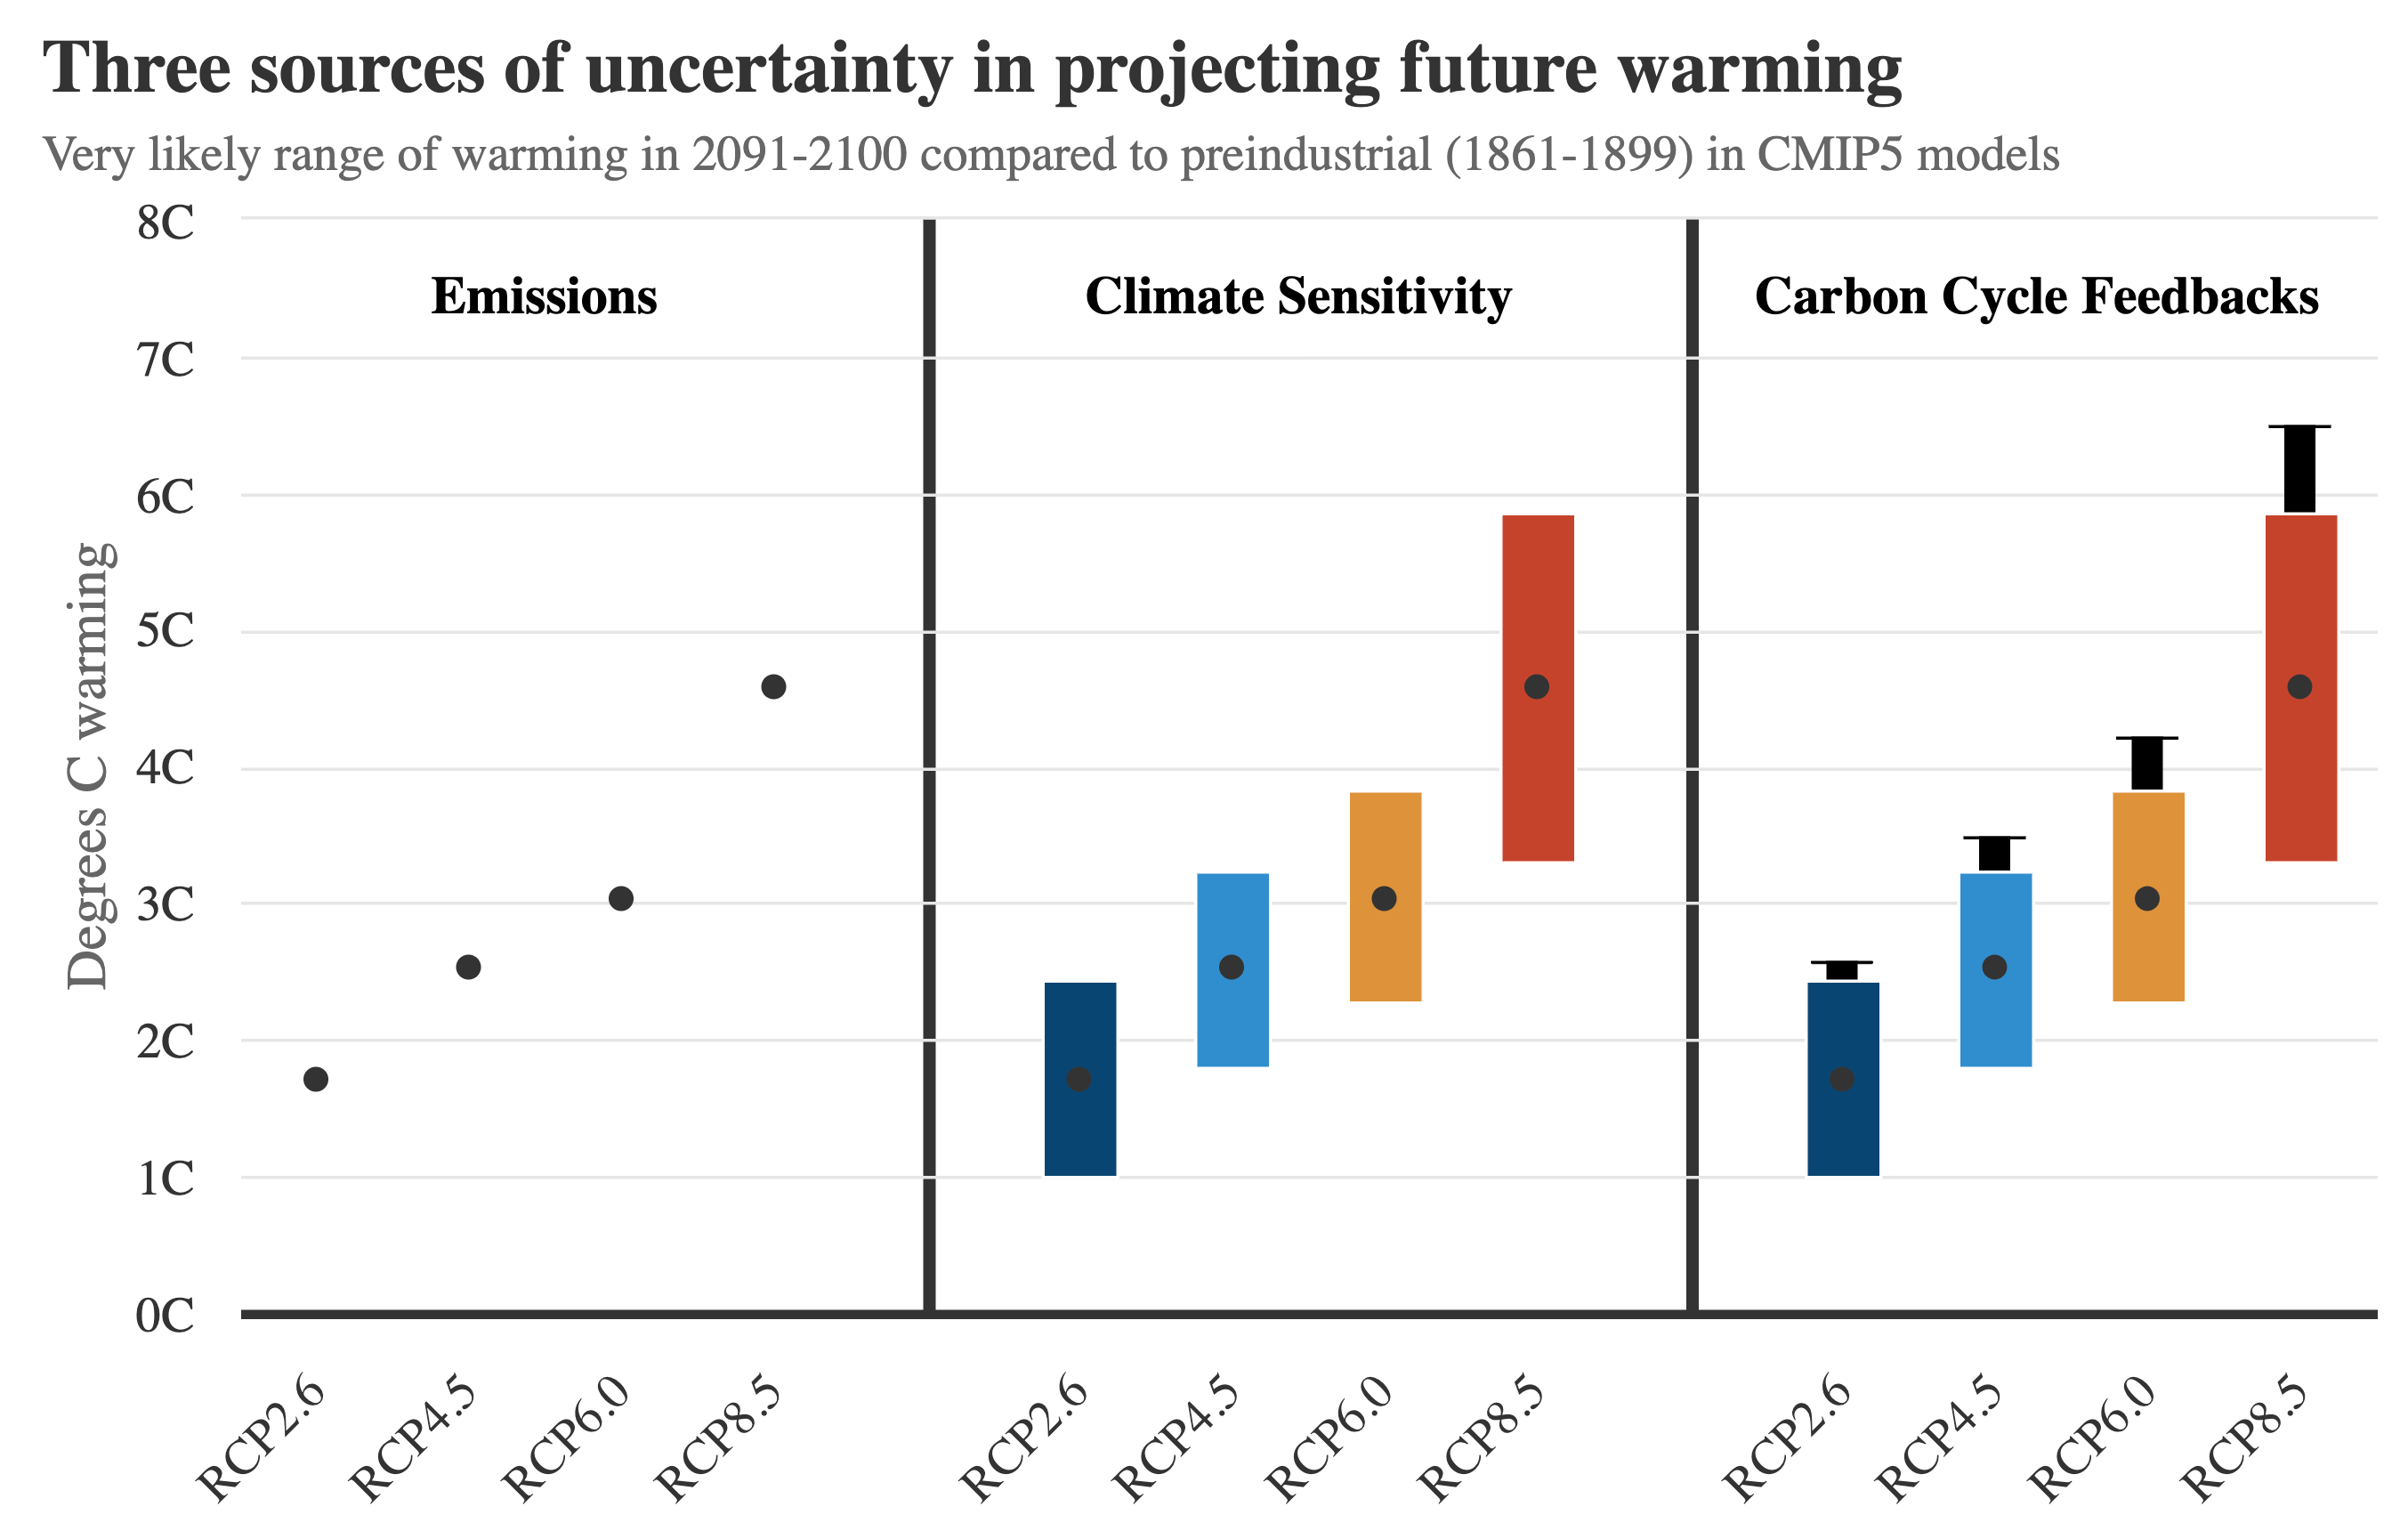 Central estimates of warming in CMIP5 models for each RCP (left panel), range of climate system responses across all models (central panel), and estimated range when carbon cycle feedback uncertainties are included (right panel). Adapted from Hausfather and Betts 2020.
This figure shows warming through 2100, but its important to note that the world does not end in 2100 even though most of our model runs do. As long as CO2 emissions remain above zero, the world will continue to warm indefinitely.
That being said, its clear that a reassessment of likely future emissions has notably lowered the range of likely temperature outcomes over the next century. The figure below shows recent assessments of likely temperature outcomes this century under three different scenarios:
Current policies - where policies in place today are maintained and trends in declining clean energy costs continue, but no new policies are enacted.
2030 commitments - where countries meet their 2030 nationally determined contributions under the Paris Agreement but enact no new policies after that.
Net-zero pledges - where countries meet their stated commitments to reach net-zero (e.g. in 2050 for the US and EU, 2060 for China, 2070 for India).
These estimates come from three different groups: the UN Environmental Programme (UNEP)’s 2022 Emission Gap Report (shown in red), the Climate Action Tracker (shown in blue), and the International Energy Agency’s 2022 World Energy Outlook (shown in yellow).
 Future warming projections in 2100 relative to preindustrial (bar shows central estimates, labels in the bar show the 90th percentile range) from the IPCC AR6 (left panel), as well as estimates from UNEP, CAT, and IEA for current policy, 2030 commitments, and net-zero pledges.
These future warming projections under current policy broadly align with the SSP2-4.5 scenario in the most recent IPCC 6th Assessment Report (grey bars), and are well below the no-policy baseline scenarios (SSP5-8.5 and SSP3-7.0).
In a recent piece in the journal Nature, Fran Moore and I assessed the literature on current policy, 2030 commitments, and net-zero pledges more broadly. The figure below shows our assessment of likely warming over the next century (red area) across these different scenarios compared to the full range in the IPCC AR6.
You can see all the individual studies that went into this assessment in the figure below (which has also been updated to include the new van de Ven et al 2023 study), The figure shows both the range of future emissions uncertainties in each study as well as full range of temperature outcomes that include climate system uncertainties.
 Range of recent future warming projections in the literature since for studies exploring current policies, 2030 NDCs, and net-zero commitments. Adapted from Hausfather and Moore 2022.
So what should our takeaway from all of this be? First, there is some good news here. The world is no longer heading toward the worst-case outcome of 4C to 6C warming by 2100. Current policies put us on a best-estimate of around 2.6C warming.
At the same time, a world of 2.6C by 2100 is still a giant mess to leave to the future, including today’s young people, who will live through that, and warming continues after 2100 in these current policy scenarios. Climate system uncertainties mean that we could still end up with close to 4C warming if we get unlucky with climate sensitivity and carbon cycle feedbacks.
Its also important to emphasize that current policy scenarios represent neither a ceiling nor a floor on future emissions. While we’ve seen a ratcheting up of policy in the past, we can’t preclude a world that backslides on both current commitments and policies, increases subsidies for fossil fuels, or otherwise leads to higher future emissions than we expect.
Ultimately, the progress we have made should encourage us that progress is possible, but the large and growing gap between where we are headed today and what is needed to limit warming to well-below 2C means that we need to double down and light a (carbon-free) fire under policymakers to ratchet up emissions reductions over the next decade. Flattening the curve of global emissions is only the first step in a long road to get it all the way down to zero.